Google Charts
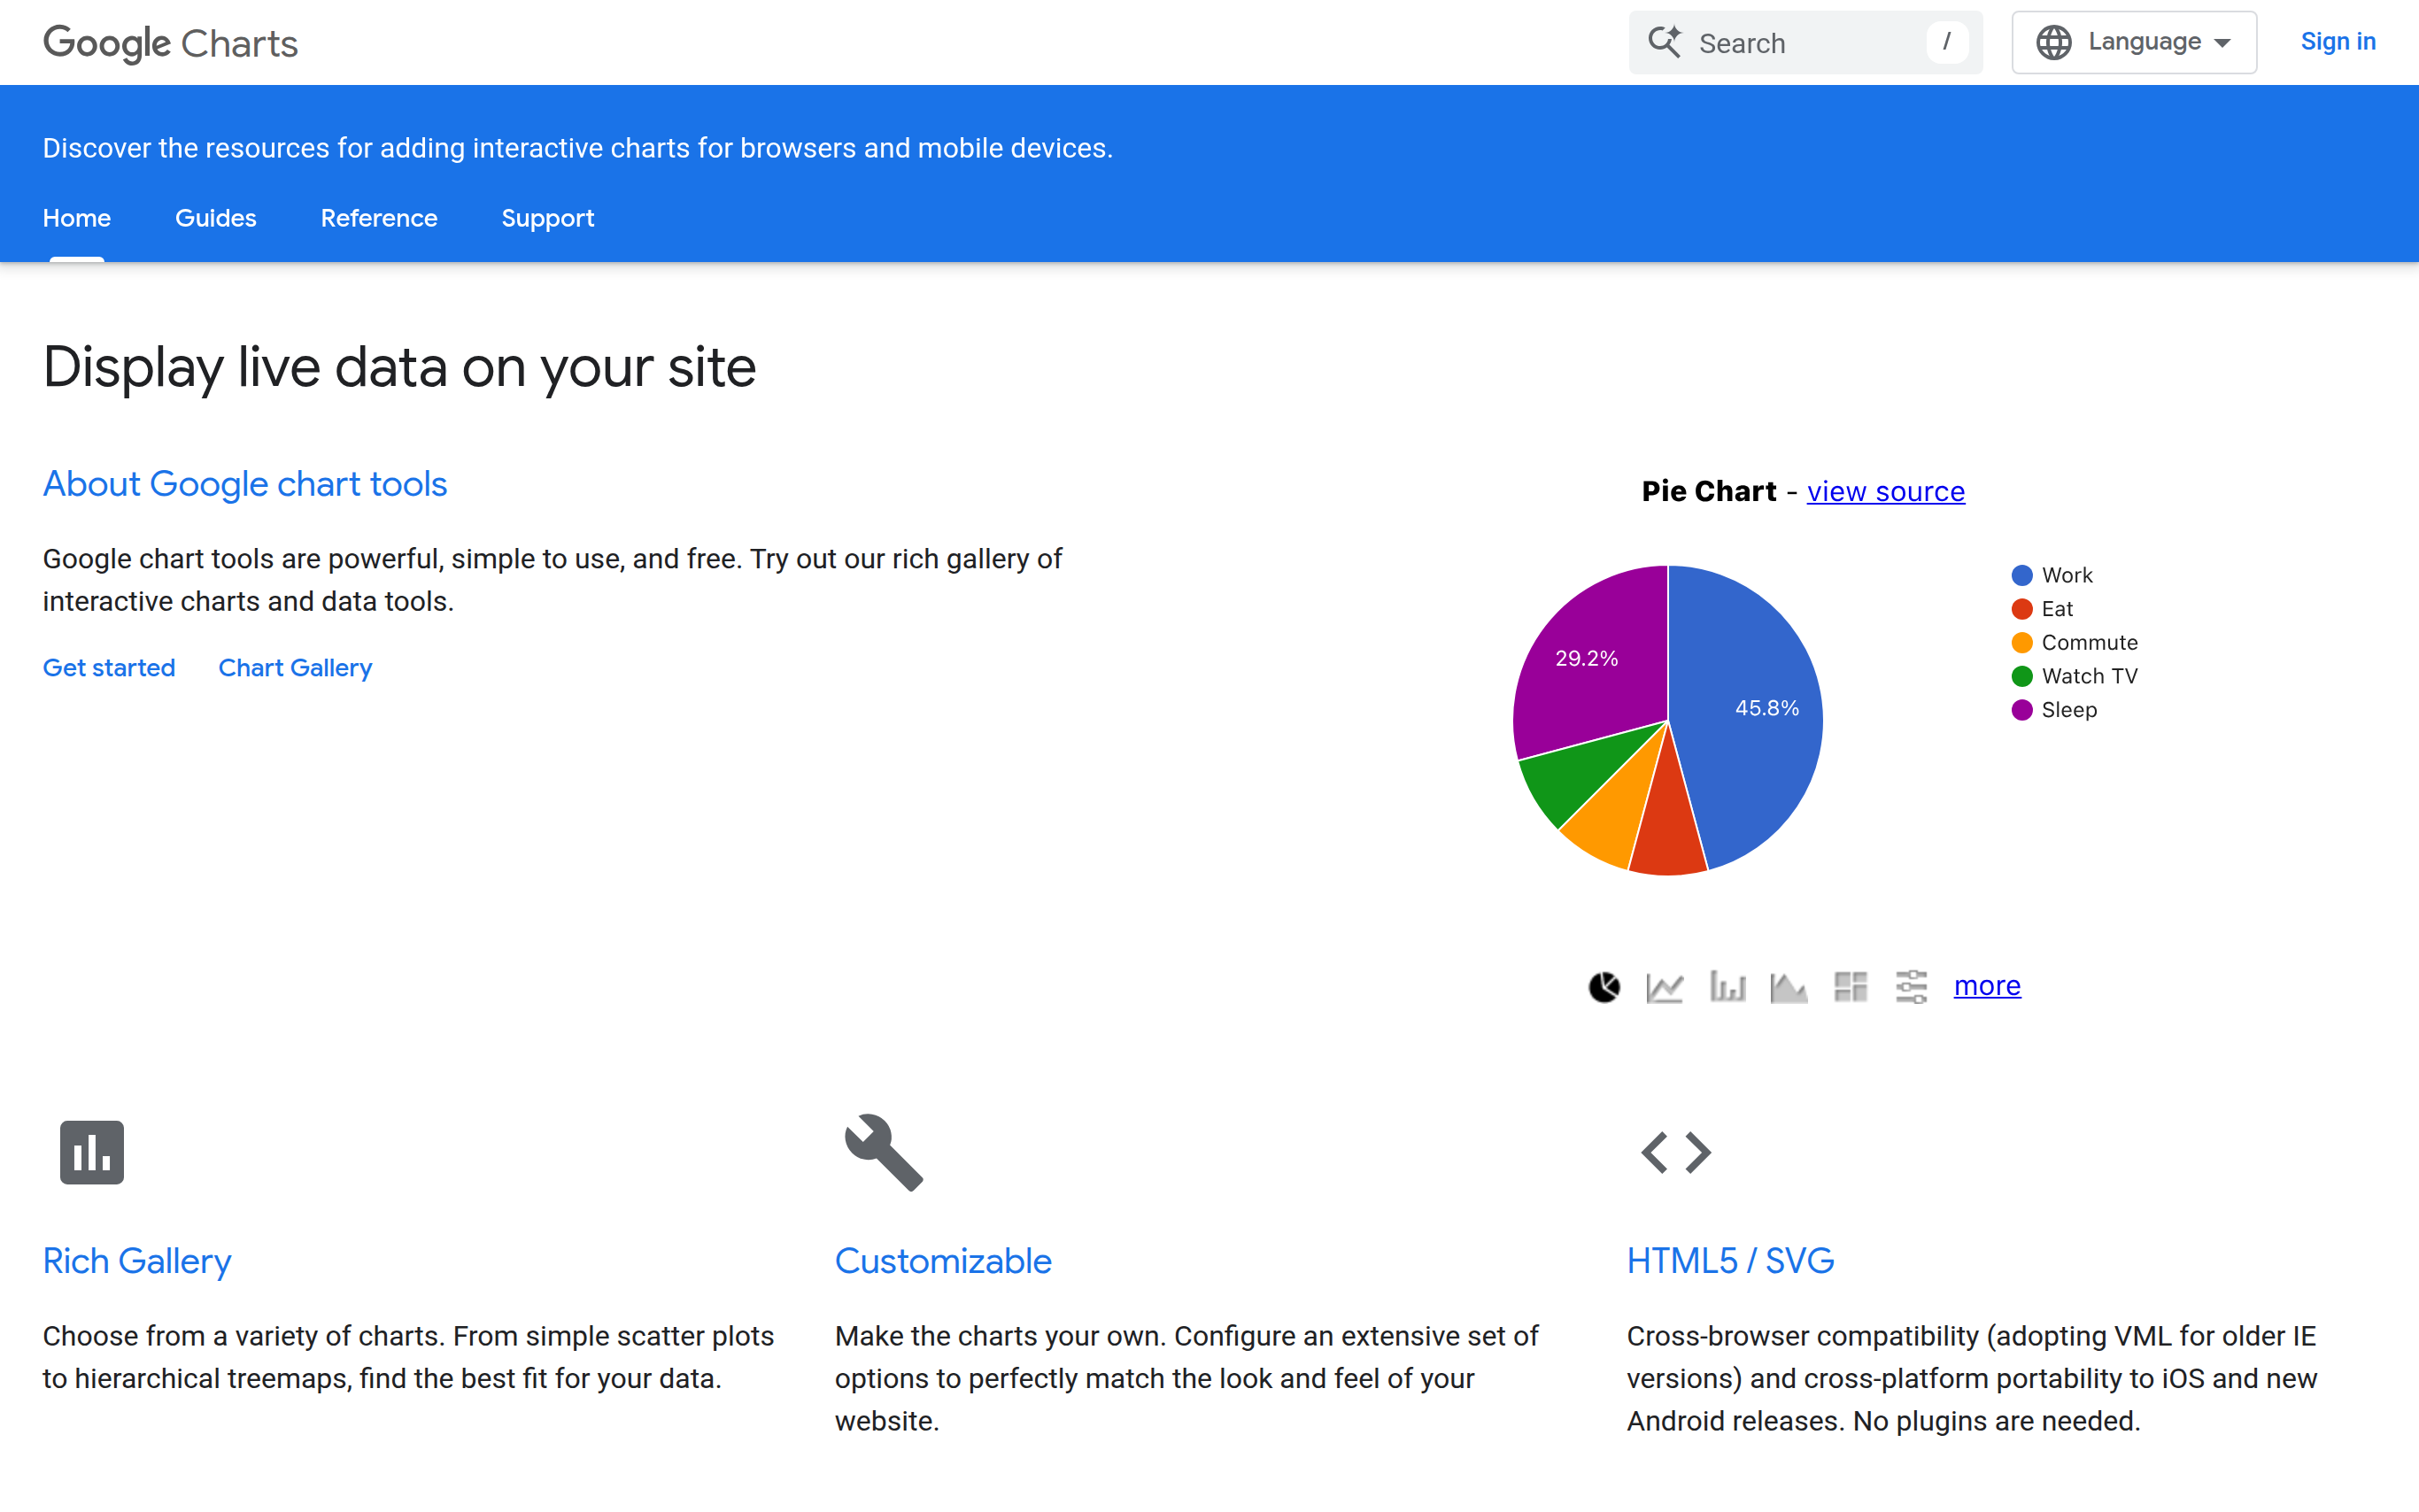
Google Charts is a powerful suite of tools designed to help users create interactive and visually appealing data visualizations directly on their websites. Leveraging HTML5 and SVG, it ensures compatibility across all major browsers while maintaining a user-friendly experience. Users benefit from a rich gallery of chart types, customizable options, and real-time data connectivity. With its broad capability range, Google Charts enables developers to present complex data in an easily digestible format, striking the perfect balance between functionality and aesthetics.
Basic Capabilities :
Data Visualization, Customizable Options, Dynamic Data Connection, Interactive Dashboards, Cross-Browser Compatibility
Basic Capabilities :
Data Visualization, Customizable Options, Dynamic Data Connection, Interactive Dashboards, Cross-Browser Compatibility
GOOD FOR
PERSONAL: Google Charts is perfect for data enthusiasts and personal project developers who need to visualize data on their websites without technical barriers. Users can create engaging representations of personal data, findings, or insights with ease.
BUSINESS: Ideal for web developers, analysts, and content creators, Google Charts enhances team workflows by providing customizable visualizations that communicate data-driven insights effectively. It supports data storytelling, aiding businesses in making informed decisions based on visual data trends.
BUSINESS: Ideal for web developers, analysts, and content creators, Google Charts enhances team workflows by providing customizable visualizations that communicate data-driven insights effectively. It supports data storytelling, aiding businesses in making informed decisions based on visual data trends.
FEATURES
RICH GALLERY: Choose from an extensive selection of charts, such as scatter plots and hierarchical treemaps, to find the perfect fit for your data visualization needs.
CUSTOMIZABLE OPTIONS: Tailor each chart with a wide array of configuration settings to align with your website's look and feel for enhanced branding.
CROSS-BROWSER COMPATIBILITY: Google Charts supports browsers across different platforms with built-in VML compatibility for older Internet Explorer versions.
FREE TO USE: Access powerful charting tools at no cost, with guaranteed backward compatibility for three years, ensuring long-term access to your creations.
INTERACTIVE DASHBOARDS: Seamlessly connect multiple charts and controls to create engaging, interactive dashboards for data presentation.
DYNAMIC DATA CONNECTION: Link your charts to real-time data sources via various connection protocols, allowing for constantly updated visualizations.
EASY INTEGRATION: The integration process is straightforward, enabling developers to quickly implement charts into their web applications.
SUPPORTIVE COMMUNITY: Utilize an active community and extensive documentation for troubleshooting and tips to make the most out of Google Charts.
PRICING
FREE: Enjoy full access to Google Charts without constraints, allowing you to create and display as many charts as you wish.
INDIVIDUAL: N/A
BUSINESS: N/A
ENTERPRISE: N/A
INDIVIDUAL: N/A
BUSINESS: N/A
ENTERPRISE: N/A
TECHSTACK
MODEL – Google Charts uses JavaScript and HTML5 to render charts in the browser, ensuring a responsive and interactive user experience.
RUNTIME – Processes data using dynamic data connections, displaying live data and adjusting charts in real-time.
DATA – Supports a variety of data formats and sources, including JSON and XML, making it versatile for diverse use cases.
INTEGRATIONS – Easily integrated with various web technologies and platforms allowing for seamless usage within existing systems.
API – Offers a JavaScript API for developers to control chart generation, configuration, and data updates programmatically.
last update : October 29, 2025