Infogram
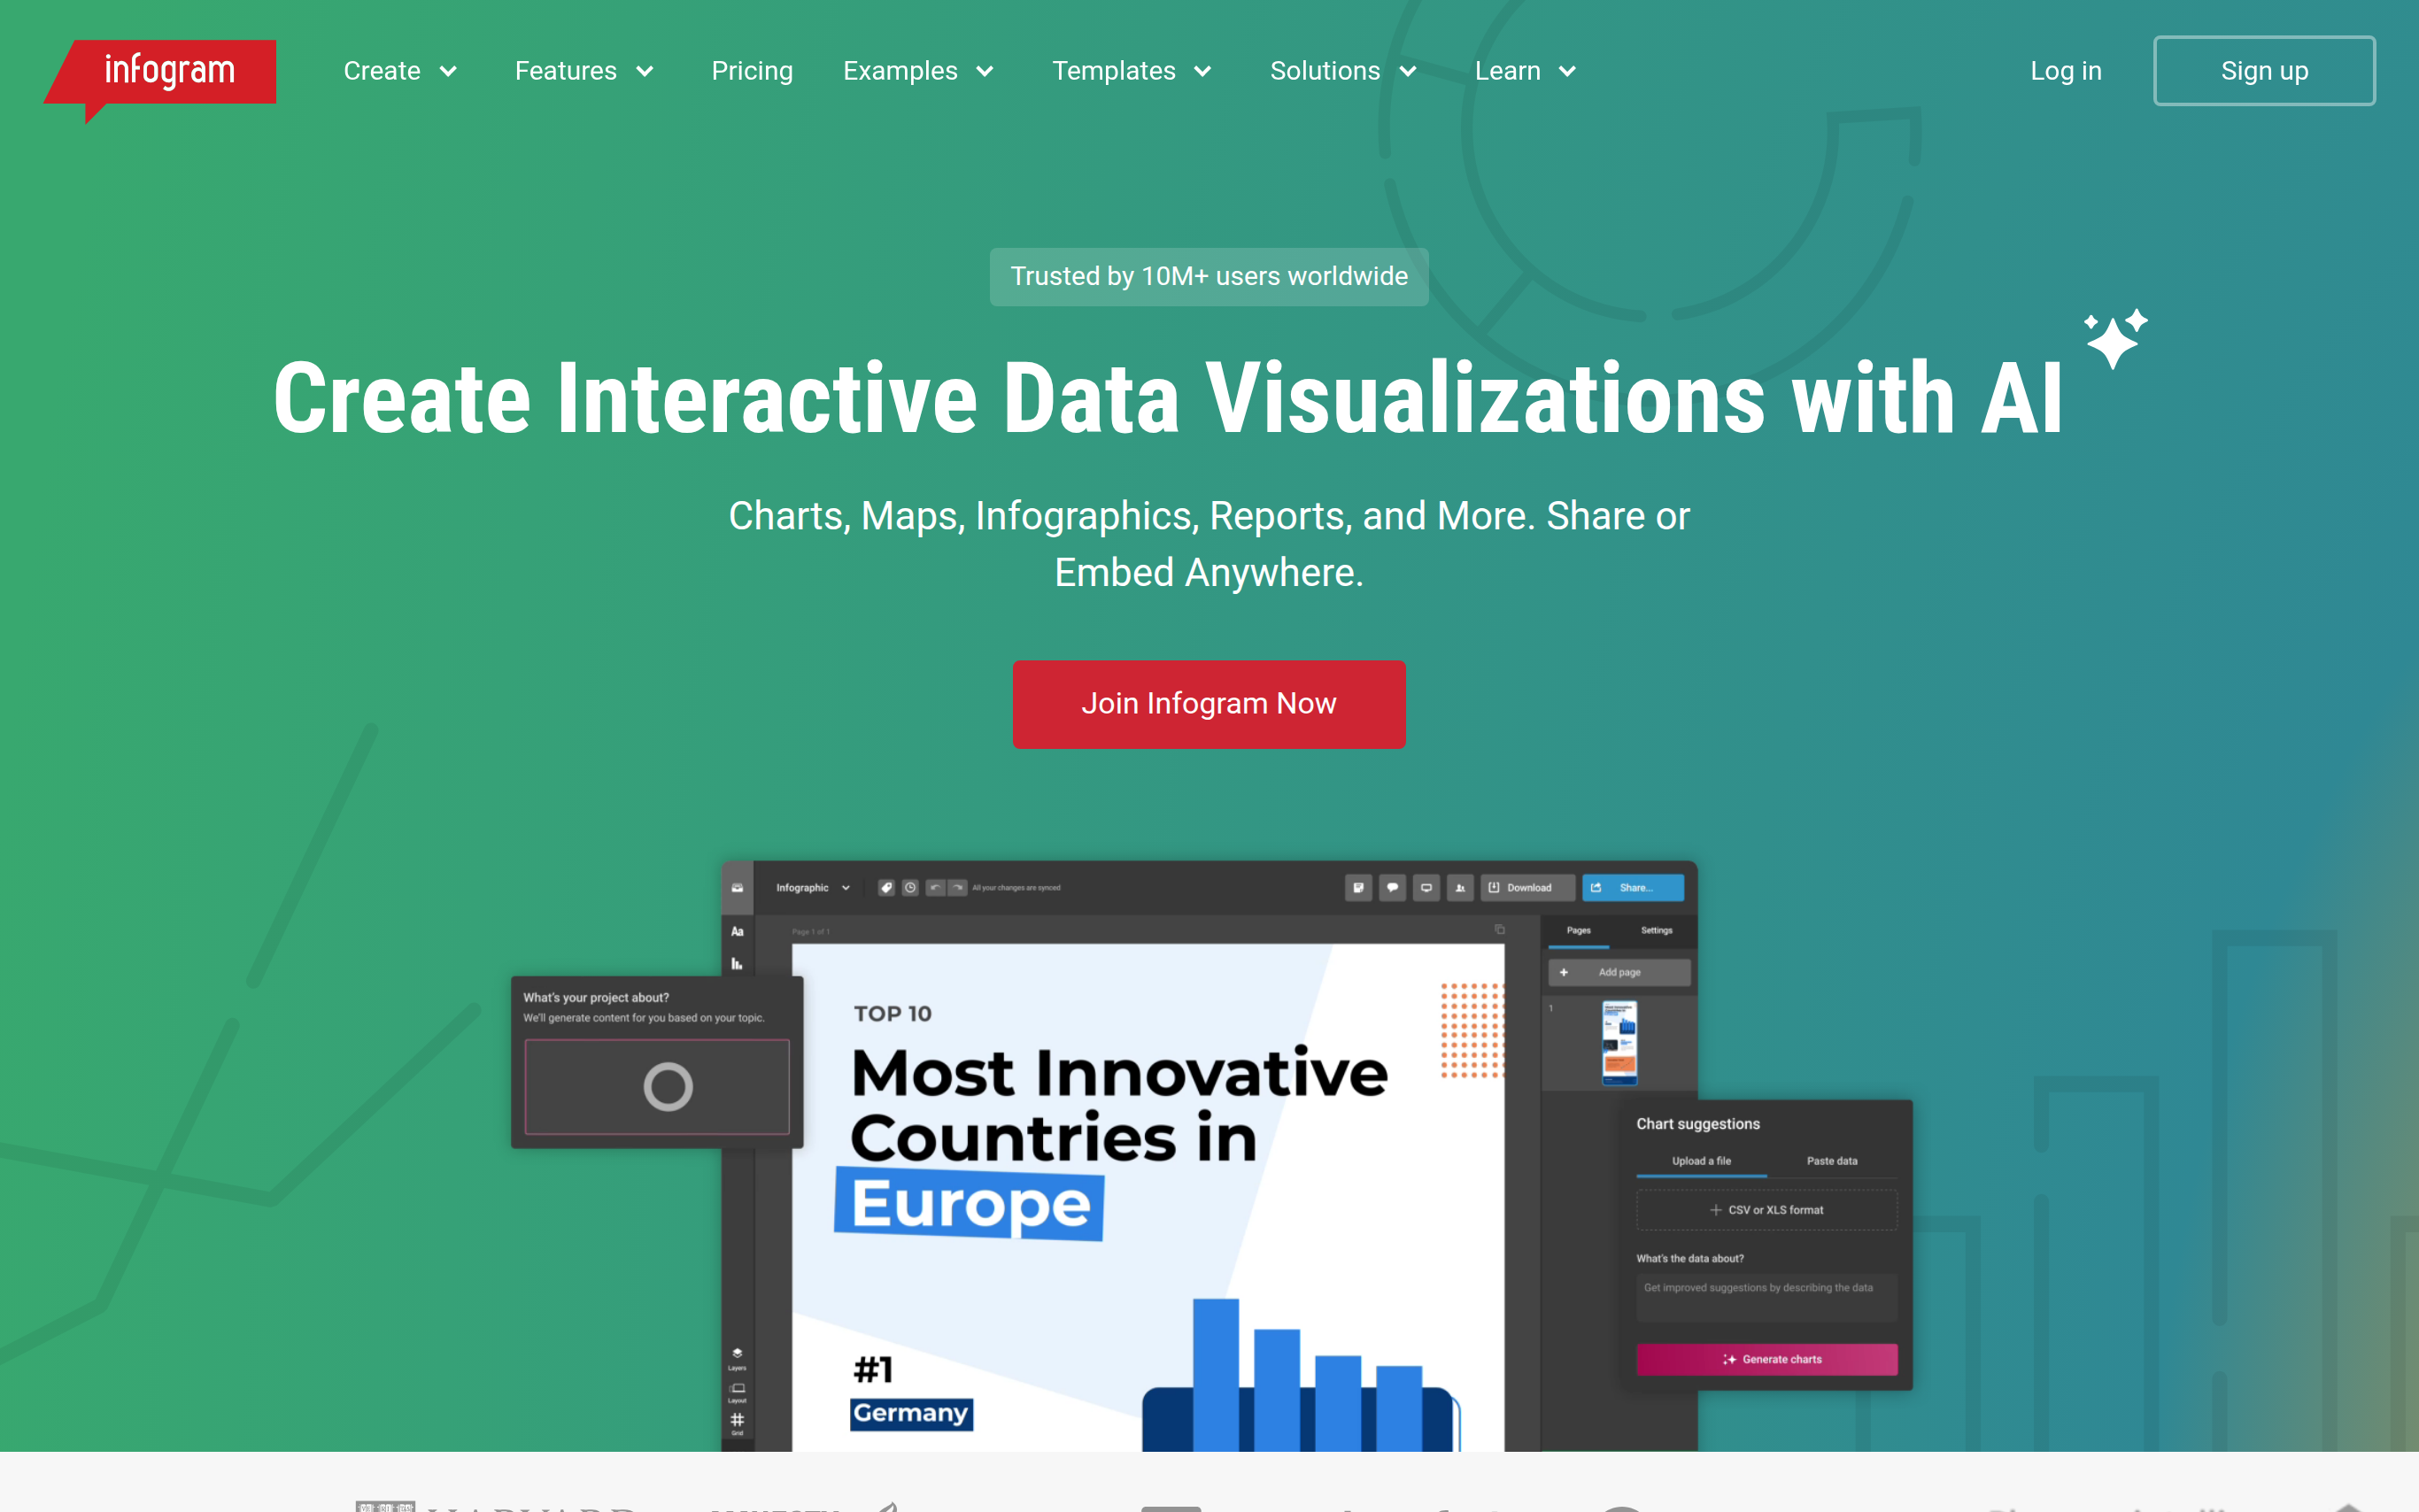
Infogram is a powerful data visualization tool designed to help users transform raw data into engaging and impactful visuals. With its user-friendly interface, Infogram allows anyone, regardless of technical expertise, to create interactive charts, infographics, and maps. The platform supports more than 35 customizable chart types and over 800 maps, making it versatile for various industry needs, from reports to dashboards and storytelling. Infogram's intelligent automation features assist users in designing visuals quickly, suggesting appropriate charts and even converting images into data to enhance productivity. The tool is perfect for businesses looking to enhance their data presentation and improve viewer engagement.
Basic Capabilities :
Data Visualization, Customizable Visuals, Interactive Elements, AI Assistance, Collaborative Workflow
Basic Capabilities :
Data Visualization, Customizable Visuals, Interactive Elements, AI Assistance, Collaborative Workflow
GOOD FOR
PERSONAL: Infogram is utilized by individuals, educators, and students who need to create actionable, clear visuals for presentations, reports, or academic projects, enhancing their storytelling capabilities.
BUSINESS: Targeted at marketing teams, analysts, and corporate communications professionals, Infogram streamlines workflows for data reporting and presentations, leading to improved viewer engagement and more efficient collaboration.
BUSINESS: Targeted at marketing teams, analysts, and corporate communications professionals, Infogram streamlines workflows for data reporting and presentations, leading to improved viewer engagement and more efficient collaboration.
FEATURES
CUSTOMIZABLE VISUALS: Users can create tailored data visuals that reflect their individual branding and requirements, ensuring a unique presentation of information.
INTERACTIVE ELEMENTS: Infogram enables the addition of tooltips, clickable elements, and animations to create a more engaging user experience.
EASY SHARING: Projects can be effortlessly shared or embedded in websites, blogs, or presentations without requiring any coding expertise.
RESPONSIVE DESIGN: The visuals generated are optimized for performance and responsiveness, ensuring they display well on any device.
WIDE RANGE OF CHARTS: Access to over 35 different chart types and 800+ maps allows users to present data in diverse and impactful ways.
AI ASSISTANCE: Infogram's AI features suggest relevant charts and automate various design tasks, enabling faster and more efficient content creation.
AUTOMATIC UPDATES: Projects automatically update when changes are made, ensuring that data visualization remains accurate and current.
INTUITIVE INTERFACE: The user-friendly interface allows both novice and experienced users to navigate the platform with ease and create professional-quality visuals.
ANALYTIC TOOLS: Built-in analytics track viewer engagement and interaction, helping users assess the effectiveness of their presentations.
COLLABORATIVE WORKFLOW: Teams can work together seamlessly on projects, streamlining the data visualization process and improving efficiency.
SUPPORT AND RESOURCES: Infogram provides extensive support and learning resources, assisting users in maximizing the tool’s features and capabilities.
CASE STUDIES: Access to numerous success stories demonstrates Infogram's effectiveness, showcasing how organizations have improved their data storytelling and engagement.
PRICING
FREE: Access basic features and create up to 10 projects with limited templates and charts. Ideal for personal use and simple data visualizations.
INDIVIDUAL: Priced at $19/month, it unlocks premium features, additional template options, and advanced chart types for more sophisticated projects.
BUSINESS: Starting at $49/user/month, this tier includes collaboration features, custom branding, advanced analytics, and admin controls ideal for teams.
ENTERPRISE: Custom pricing available, providing top-level security, compliance, dedicated support, governance features, and extensive customization options for larger organizations.
TECHSTACK
DATA MANAGEMENT – Robust data handling capabilities with easy integration from various sources to streamline data input.
USER INTERFACE – Built on a modern web framework for a seamless and intuitive user experience across devices.
INTEGRATIONS – Supports a variety of third-party integrations, enhancing functionality and allowing users to connect with their favorite tools.
API ACCESS – Offers a comprehensive API that enables developers to embed Infogram features directly into their applications or services.
SECURITY FEATURES – Advanced security protocols ensure user data is protected and compliant with industry standards.
last update : October 29, 2025