RAWGraphs
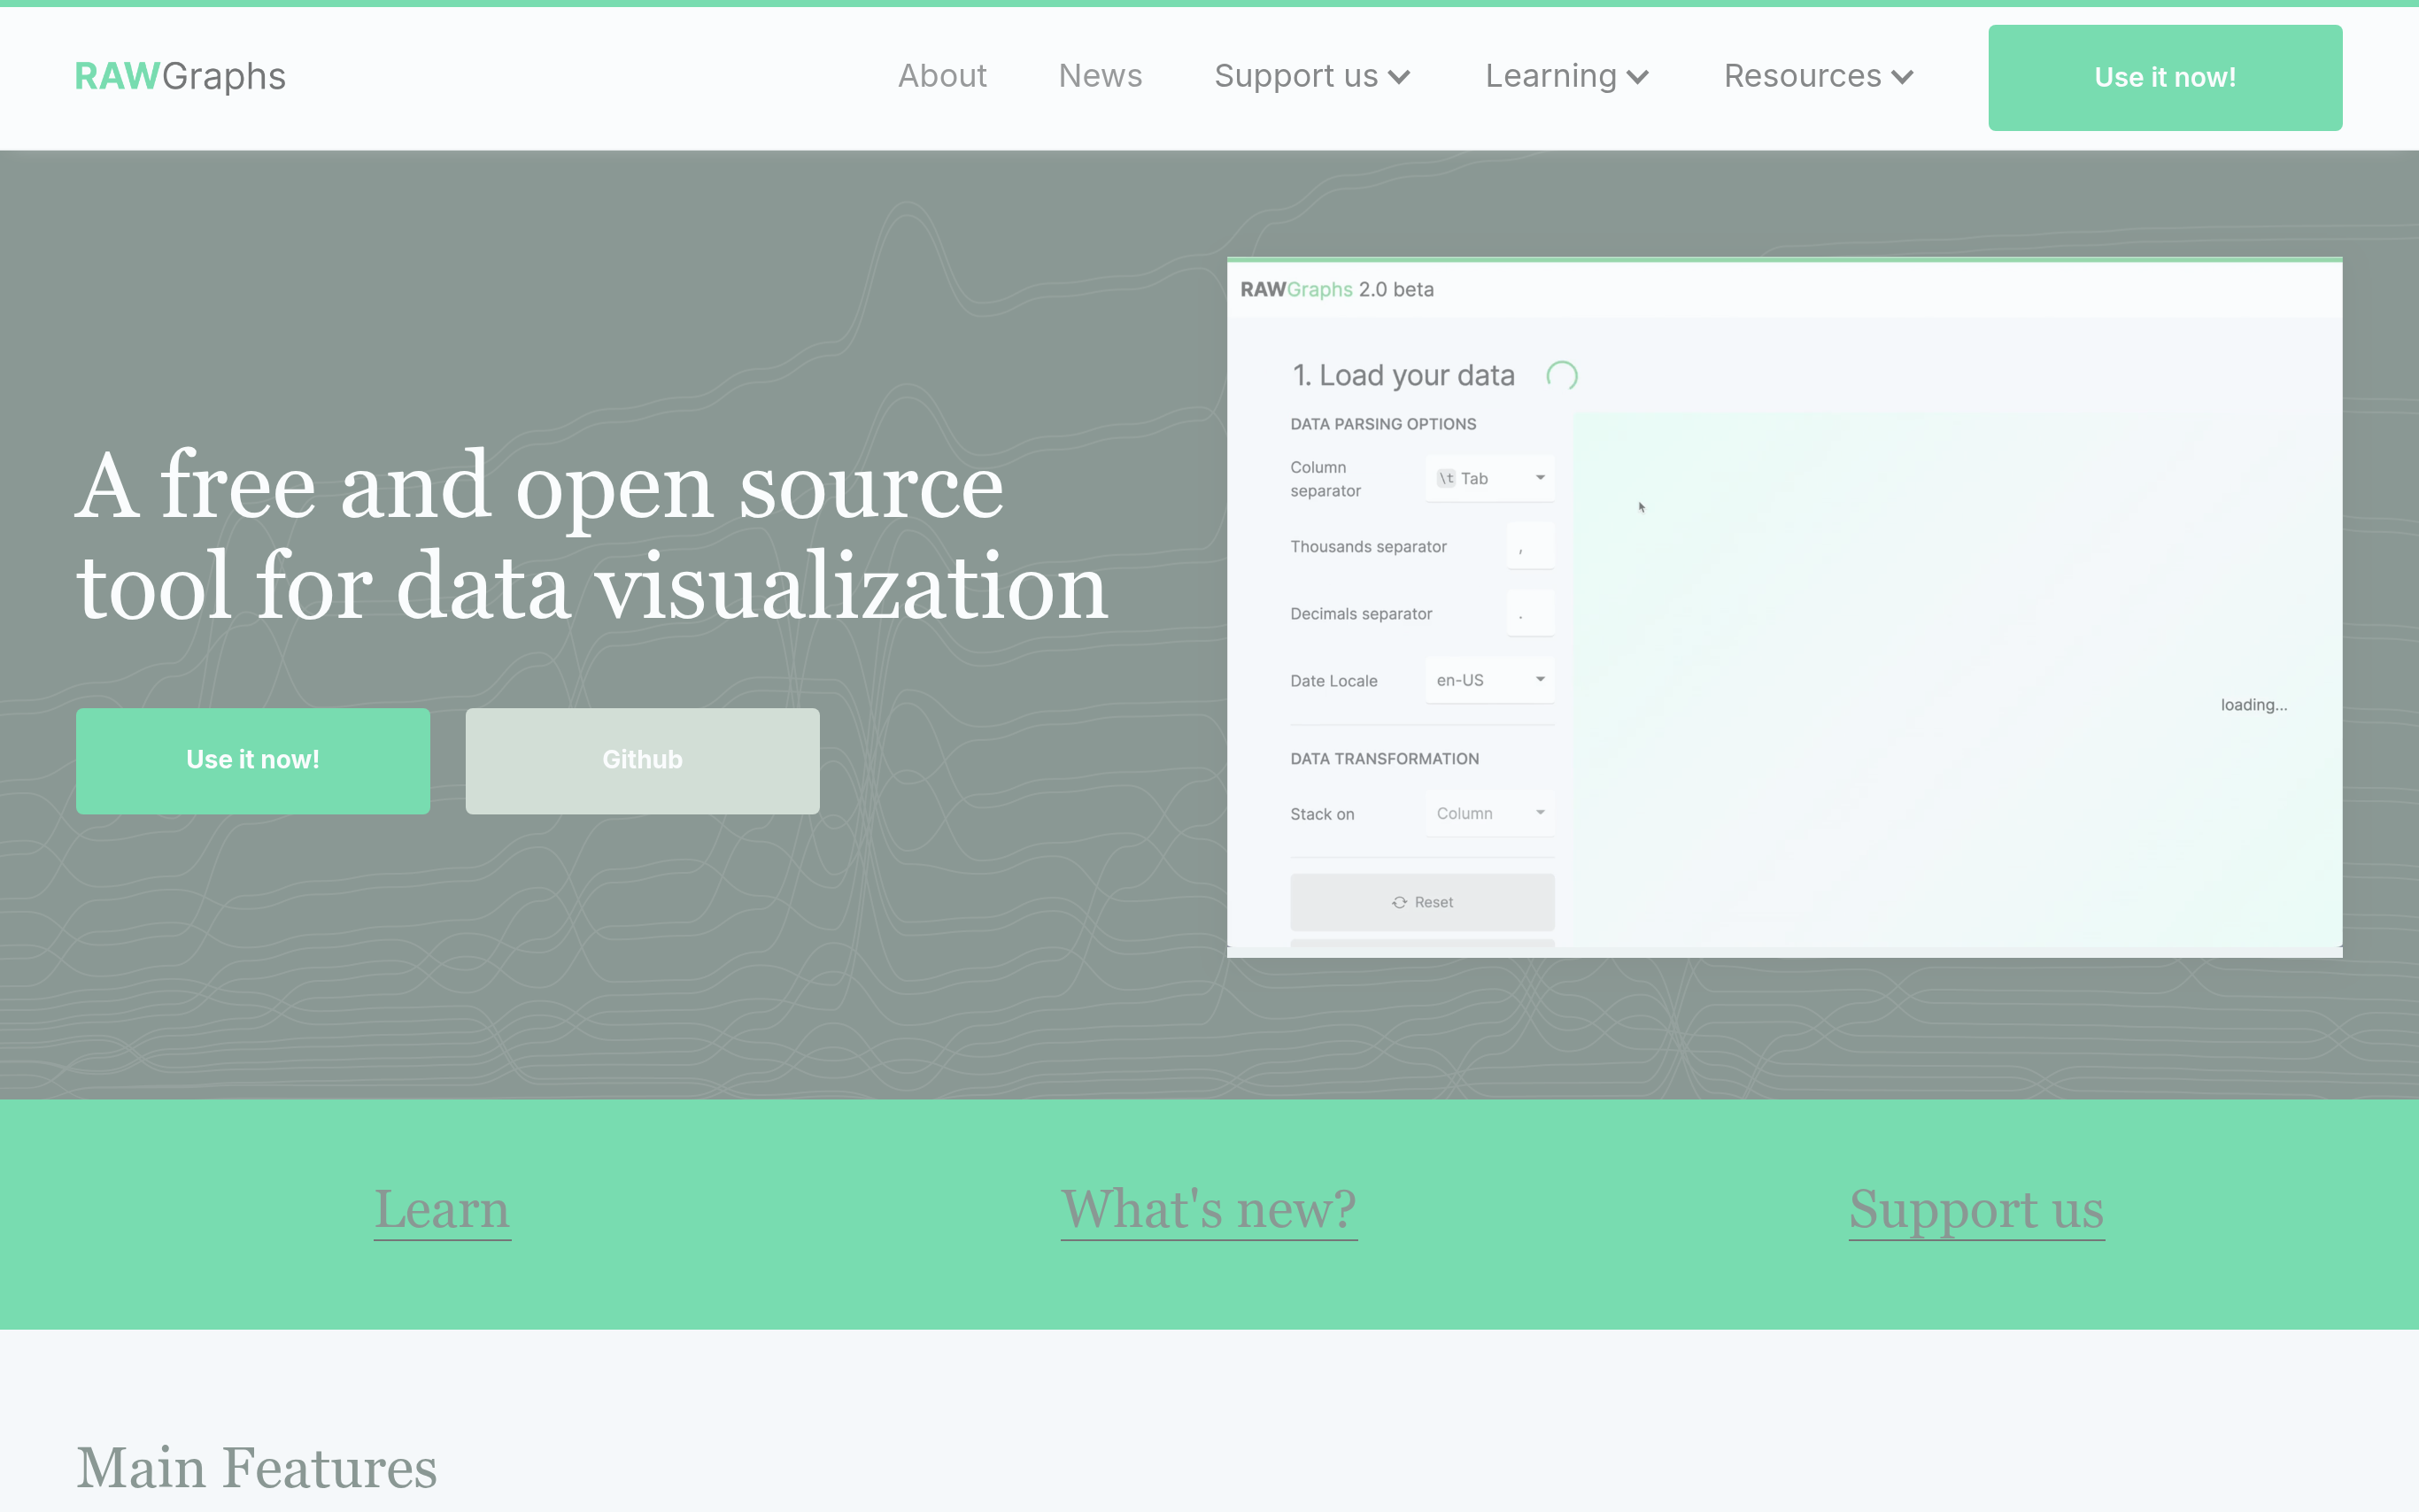
RAWGraphs is an open-source data visualization framework designed to provide an intuitive space for users to create and share visualizations. Built on top of a variety of open-source projects, it offers nearly 30 customizable visual models to help users visualize quantities, hierarchies, and time series data effectively. The browser-based architecture ensures that all data processing occurs locally, giving users full control over their information. This unique approach emphasizes accessibility and flexibility, allowing for exports in both vector and raster formats for further editing. With contributions from the community, RAWGraphs continuously evolves to meet user needs while encouraging collaboration and innovation.
Basic Capabilities :
Data Visualization, Browser-Based Processing, Export Options, Customization Capabilities, Collaborative Environment
Basic Capabilities :
Data Visualization, Browser-Based Processing, Export Options, Customization Capabilities, Collaborative Environment
GOOD FOR
PERSONAL: Ideal for data enthusiasts, students, and researchers who seek to visualize data for presentations or personal projects, enabling them to express insights clearly.
BUSINESS: Suitable for data analysts, marketers, and teams across various industries, RAWGraphs enhances storytelling through data, boosts collaboration, and improves decision-making based on visual insights.
BUSINESS: Suitable for data analysts, marketers, and teams across various industries, RAWGraphs enhances storytelling through data, boosts collaboration, and improves decision-making based on visual insights.
FEATURES
DIVERSE VISUAL MODELS: Access nearly 30 different visual models that cater to a variety of data types, making it easy to convey complex information.
BROWSER-BASED PROCESSING: All data processing occurs directly in your browser, ensuring data privacy and security while eliminating server-side risks.
EXPORT OPTIONS: Export your visualizations as either vector or raster images, allowing seamless integration with your favorite editing software.
USER-FRIENDLY INTERFACE: The intuitive interface is designed for both beginners and experienced users, making the visualization process efficient and straightforward.
OPEN-SOURCE COMMUNITY: Contribute to and benefit from an engaged community of users and developers who enhance the platform continuously.
DATA INSIGHTS: Transform raw data into clear visual representations that help identify trends, relationships, and insights effortlessly.
CUSTOMIZATION CAPABILITIES: Tailor your visualizations by adjusting parameters and settings, giving you the flexibility to represent your data as needed.
COLLABORATIVE ENVIRONMENT: Share your projects with others and collaborate on data visualizations, fostering teamwork and collective insights.
PRICING
FREE: Access to all visual models and features without any fees, ideal for individual users and small projects.
INDIVIDUAL: For $10/month, unlock exclusive options and premium support, enhancing the usability of the platform.
BUSINESS: Starting at $50/user/month, this plan offers advanced admin controls, SSO/SAML integration, and team collaboration tools for medium-sized organizations.
ENTERPRISE: Customized solutions are available with enhanced security, governance features, compliance management, and dedicated support for large enterprises.
TECHSTACK
DATA VISUALIZATION FRAMEWORK – RAWGraphs utilizes advanced web technologies to ensure that data visualizations are rendered smoothly and interactively.
LOCAL DATA PROCESSING – The architecture is designed for browser-based processing, allowing users to manage their data without external dependencies.
EXPORT FUNCTIONALITY – Offers integration with various formats, ensuring visualizations can be exported for different applications and workflows.
OPEN SOURCE LIBRARY – Built upon open-source technologies, enabling community contributions and continual improvements in features and capabilities.
USER INTERFACE DESIGN – Focused on user experience, the interface provides an interactive platform allowing easy manipulation of data and visual outputs.
last update : October 30, 2025